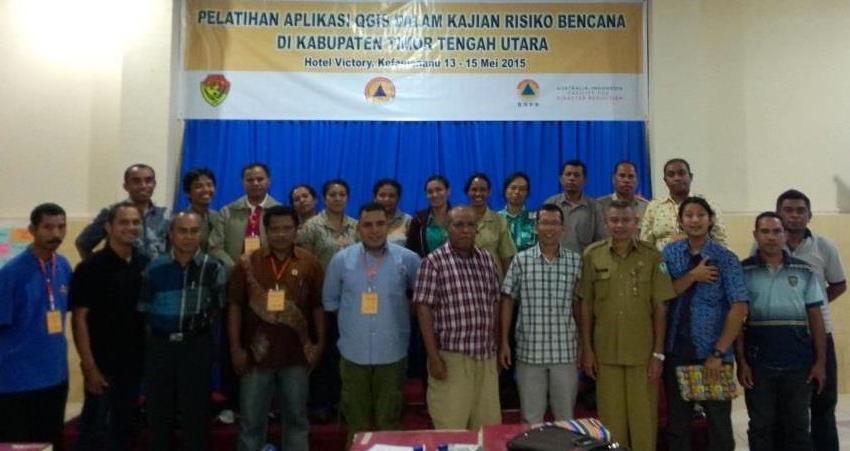
On May 11th-15th 2015, Humanitarian OpenStreetMap, RNV and CDSP held disaster risk assessment workshop and training in Kefamenanu, TTU (Timur Tengah Utara), East Nusa Tenggara. This workshop and training divided by 2 part, first part is workshop and training for disaster risk assessment and the second part is about using QGIS for disaster risk assessment. This activity is part of creating disaster risk assessment document for district TTU. Specifically, this training aim to give knowledge and skills about disaster risk assessment, exposure mapping and also using QGIS and InaSAFE for disaster risk assessment. It can give participant the whole process of disaster risk assessment process, starting from preparation, data collection and explanation steps.
This workshop and training began with welcome greeting from Head of BPBD from district TTU, representative from BPBD East Nusa Tenggara Province, and CDSP. There are 20 participants that attend the training and workshop from BPBD East Nusa Tenggara, BPBD TTU, Health Department, Agricultural Services, Mining Department and Mineralogy, Sat Pol PP, BAPPEDA, Civil Works Department, Department of Forestry, Department of religion, and NGO.
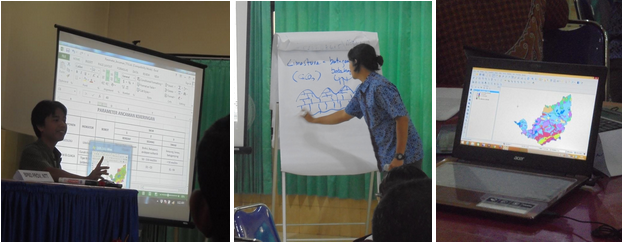
The first day of the workshop, participants learn about the concept of risk assessment document, with example of their own area, TTU district. Began with pretest about disaster risk assessment to know their early knowledge about it. After that participants got quick explanation about the paradigm of disaster management and concept of risk assessment document by BPBD East Nusa Tenggara. Next session was from BMKG that explained about all of their products from BMKG related to disaster. The next session after lunch was focus group discussion. All the participants divided by 3 groups and asked to discuss to each other about specific topic for each group and then presented it in the end of the session. This session aim to improve participant’s knowledge about risk, vulnerability, capacity and hazard in their area in order to prevent and face the disaster in their own area. After they got a background of their own hazard, capacity and risk in their area, they asked to think about the steps of disaster risk assessment and what data they need in order to achieve that.
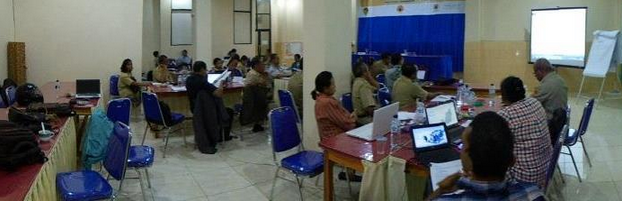
The next day of the workshop, participants began to prepare statistical data from BPS to spreadsheet. Divided by 4 small group, each group must filter and sort data from BPS according to their task, create one spreadsheet vulnerability data and capacity data. All those data must according to indicators that they already discussed before. After the spreadsheet data already created by participants they start to learn about QGIS. The materials that HOT covered in QGIS was about basic operational of qgis, adding vector data, adding raster data, simbology, labeling, table attribute, query, field calculator and join table from spreadsheet data to vector data. In the end of this day, the participants already have vector data that have capacity and vulnerability data inside it.
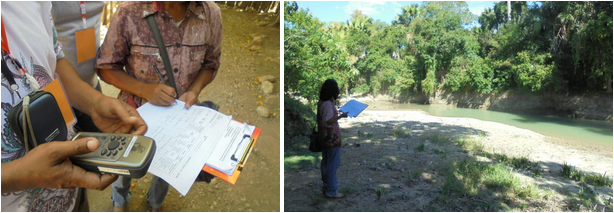
On the third day, all the participants learn about how to use GPS and give input in survey form. They must to collect the data in given areas. The way we decided which area need to be surveyed was based on recommendation from BPBD and participants. There are six area that need to be surveyed, Nonotbatan Village (Sub-district Biboki Anleu), Amol Village (sub-district East Miomafo), Faenake village (sub-district North Biboki), Banu’an Village (sub-district Inasafa Fafinesu), Fatumtasi Village (sub-district North Insana), and Atmen Village (sub-district West Insana). We divided participants into 4 team and each team equipped with 2 GPS and survey form. They mark waypoint only for public facilities, spring water, and disaster area. For survey form, they got 3 type of survey form, public facilities form, form disaster area, and vulnerability interview for flood and drought hazard. This survey take whole day because the survey area is very far from training location and most of the groups come back to training location at 3pm. After survey, participants need to export GPS data with QGIS to shapefile format and input all the result from survey form to the shapefile.
There are break in day fourth because it’s a Christian public holiday and most of the participant go to the church. We began the workshop again in the last day, it still have so much things to do in the last day because we have one day off but we manage to reach all the core material. In the last day, participants need to create risk map based on all the data that they already created several day before. All the participants learn how to create scoring to capacity and vulnerability data, overlay vector data and create map from that. After they create capacity, vulnerability and hazard map, they learn how to evaluate the risk. In this session facilitator explain about how to evaluate the impact of disaster in certain area in the several vital component population, infrastructure, landuse, and economy. This valuation use QGIS and spreadsheet features (Pivot Table). Once the valuation of the impact of disaster was finished, the participants take the post-test to evaluate their knowledge.