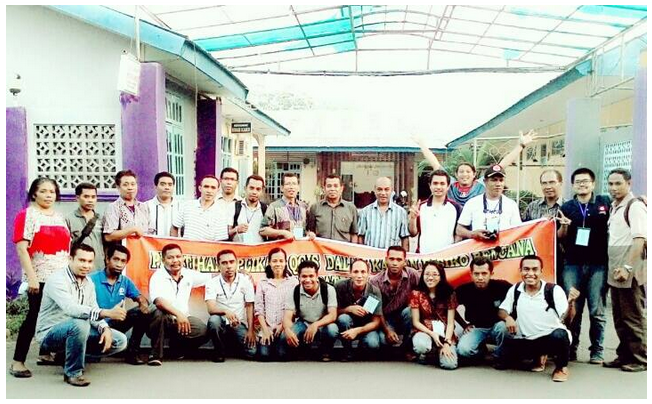
Disaster management planning in each area requires the assessments that related to disaster risk. Therefore, The Capacity Development Support Program (CDSP), BPBD Provinsi NTT cooperated with AIFDR hold QGIS Application Training in Disaster Risk Assesment held over three days (May 27-29, 2015). This activity itself was still in a series of Disaster Risk Assessment Training and Workshop held two days earlier (May 25-26, 2015). Nagekeo District has been the target of these trainings because they don’t have a disaster risk assessment document and they give enthusiastic response to the needs of regional disaster management planning.
There were 23 participants who are representative of BPBD NTT Province, BPBD Nagekeo District, Health Service, Agriculture Service, BAPPEDA, Public Works Service, Forestry Service, Social and Employment Service, Nagekeo Environmental Agency and NGO (YMTM, Wahana Visi Indonesia, and Plan Indonesia). All participants had never attended to QGIS or InaSAFE training.
The Activities
One day before this QGIS training, participants process Village Potential (PODES) data together to create vulnerability and capacity data of Nagekeo in tabular form (Excel). Once the vulnerability and capacity data available, the next step is combining tabular data with spatial data so that later can produce the vulnerability and capacity maps.
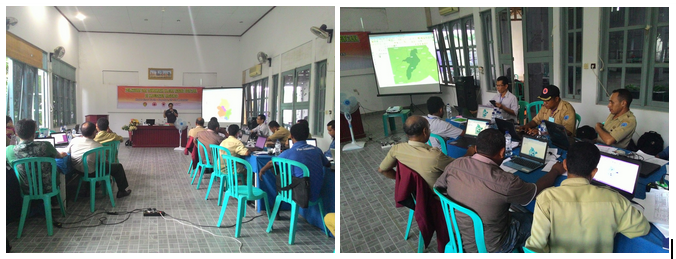
To Start making vulnerability – capacity maps, participants are introduced about QGIS. The material being taught are, (i) QGIS interface, (ii) adding vector data, (iii) simbology and (iv) labelling. After QGIS introductions, then they begun practice JOIN Data (combining tabular data to the map). At the end of the session they have been able to produce the vulnerability and capacities maps.
Day 1
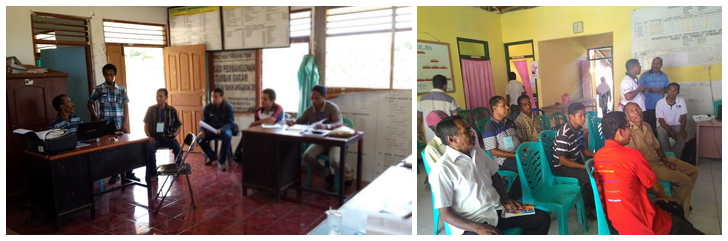
First day of training was field survey practice to collect data in priority areas.
- Aesesa: Desa Waekokak, Desa Mbay II
- Wolowae: Desa Anakoli, Desa Totomala
- Boawae: Desa Mulakoli, Desa Rigi
- Nangaroro: Desa Woewutu, Desa Woedoa
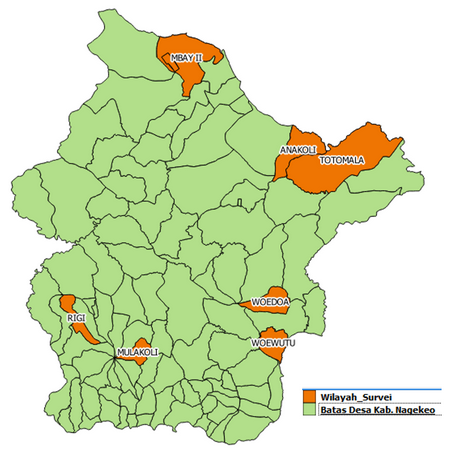
Field Survey activity was divide into two activity, there are collecting public facilities data such as school, hospital, church, etc using GPS and survey form and interviewing people and village officials about disaster that occurred in their village. The disaster were surveyed in this activity including floods, droughts, earthquakes, landslides and volcanoes.
Day 2
Day 2 activity started with inputting field survey data that they collected yesterday. They were inputting their GPS datas to the computer using QGIS. Moreover, they also rewrited the results of interviews that can be used to give more explanations and analysis descriptions for every hazard. In the afternoon to the end of the day, they practiced making hazard and risk map.
Day 3
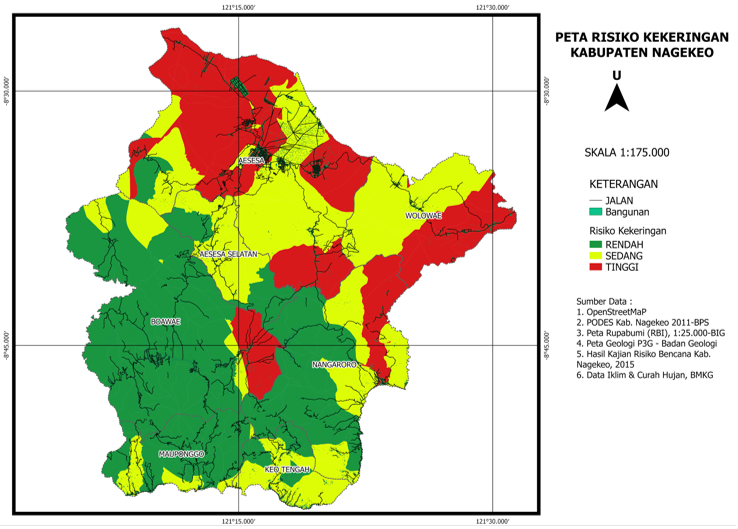
Friday morning started with disaster risk valuation material. The variables calculated in the valuation of this risk were, (1) Buildings, (2) Public facilities, (3) People, (4) Settlement, (5) Rice field, and (6) Farm.
This risk valuation calculations used InaSAFE to calculate buildings and people variable, while the other variables calculated with overlaying method for each variable with hazard data. The results then were calculated with Microsoft Excel (Pivot Table) then generate exposure data and impact in each hazard zone such as the number of buildings affected, people affected, agricultural area affected, etc.
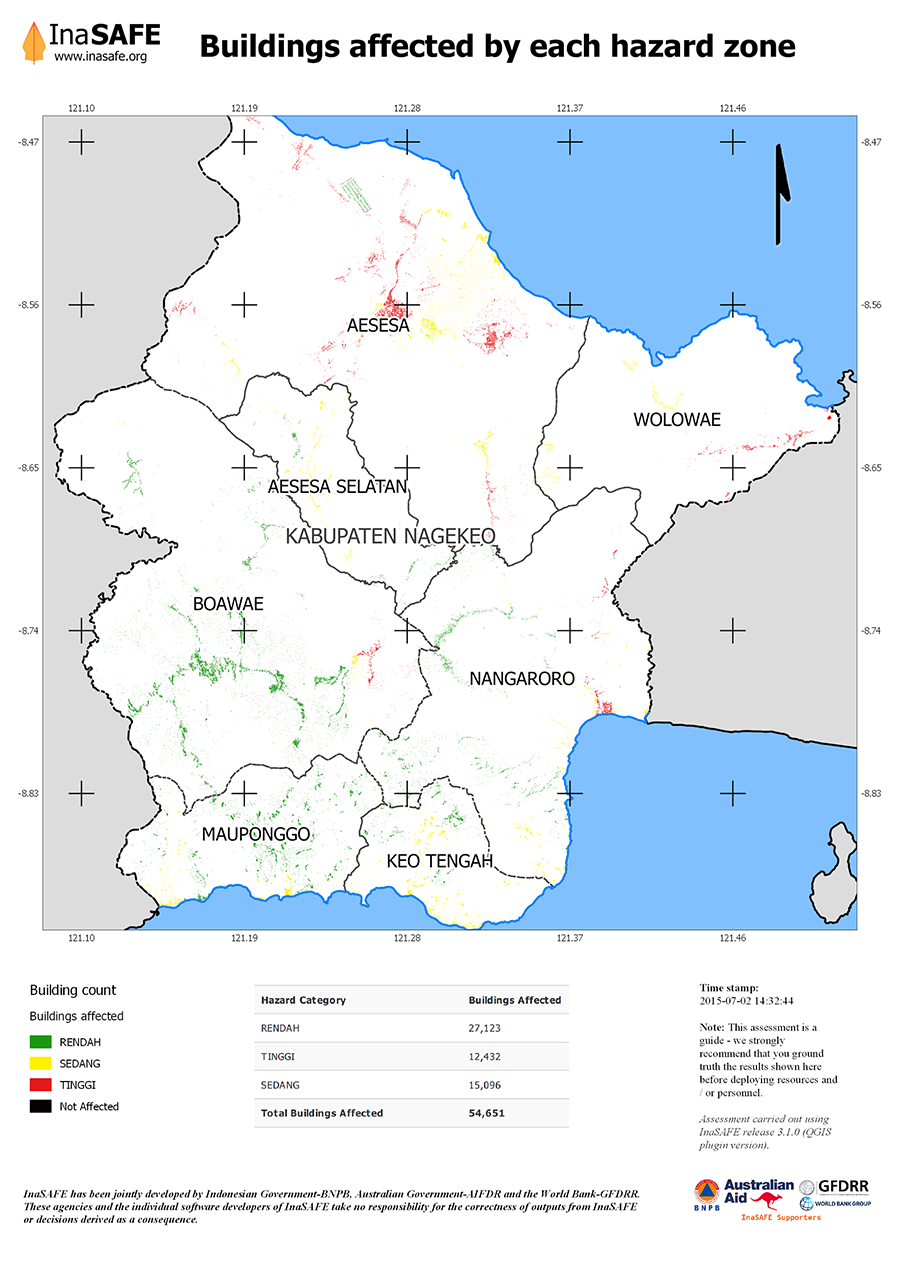
After the Risk Valuation session completed, then they went to Map Composer session. They were guided to make good disaster risk maps, that can be understood easily by the readers and ready to be printed. Here is one of disaster risk map by participants: